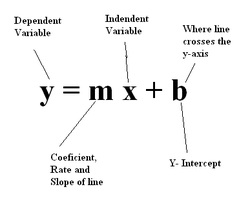
Just last week in math we were talking about the equation y=mx+b. Well, if you guys didn't already know in the equation y is the dependent variable. The m is the slope or the rate of the line. X is the independent variable. Last but not least the b is the Y-Intercept. As you can see all of these things are mentioned in the picture to the left.
This equation is helpful when they give you a graph that you have to place it in. For example let's say they give you the equation y=2/3x+3. This is when you will have to use the equation y=mx=b for a resource. Also know that when you are graphing the equation you will have to end up with a straight line.
This equation is helpful when they give you a graph that you have to place it in. For example let's say they give you the equation y=2/3x+3. This is when you will have to use the equation y=mx=b for a resource. Also know that when you are graphing the equation you will have to end up with a straight line.
 RSS Feed